Eating out in Malaysia: how to read the latest food-price figures
The latest official figures put food-away-from-home inflation at 2.6%. A closer reading matters more than the headline alone.
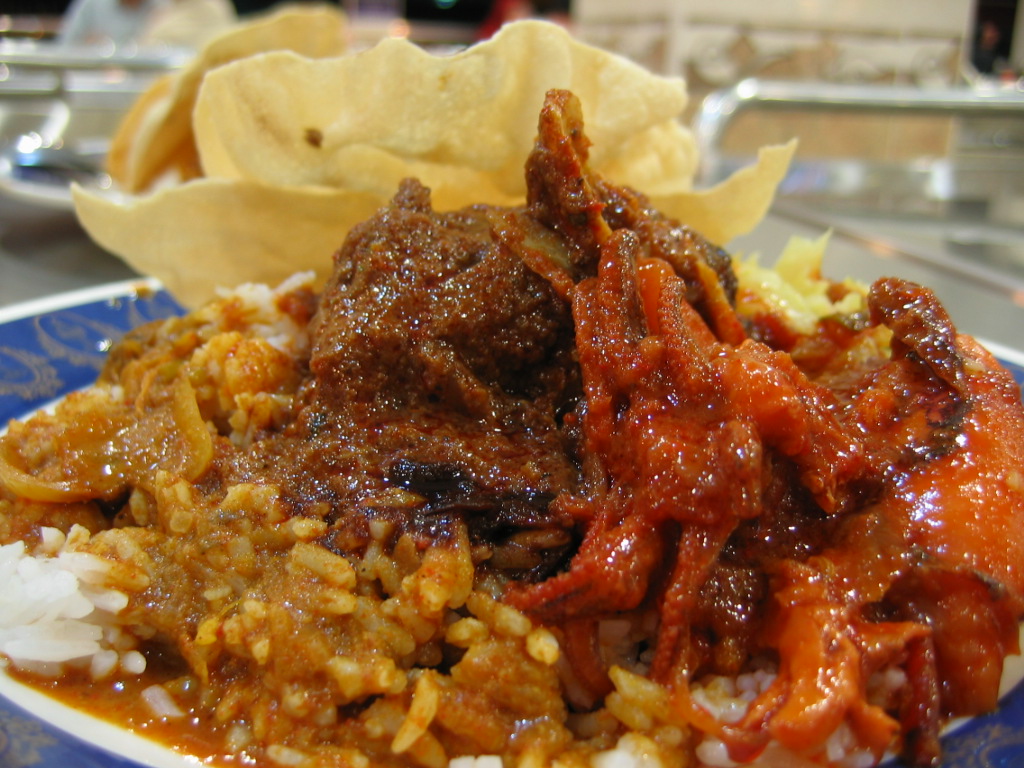
Photo: eightysixx / Nasi kandar (Wikimedia Commons) / CC BY-SA 2.0. Original downloaded file; cards use a display crop; no retouching. The photograph remains available under its linked licence.
Malaysia’s food-away-from-home price index rose 2.6% year on year in September 2026, compared with 2.5% in August, according to the Department of Statistics Malaysia’s 19 October CPI release. Food at home rose 1.2%, while the wider Food & Beverages group rose 1.8%.
Those figures describe different baskets of spending. They are useful context for a conversation about eating out, but they do not tell us what happened to every restaurant bill.
| Price group | Year-on-year change |
|---|---|
| Food away from home | +2.6% |
| Food at home | +1.2% |
| Food & Beverages overall | +1.8% |
The comparison is with last year
Year-on-year inflation compares an index with the same month a year earlier. Here, that means September 2026 against September 2025. It does not mean food-away-from-home prices rose 2.6% between August and September.
A simple illustration: a basket costing RM100 in the earlier period would cost RM102.60 after a 2.6% rise. This is arithmetic to explain the rate, not a price quote, a forecast or a claim about a particular meal.
A slower increase is still an increase
The difference between a rate and a price level can make headlines confusing. If an annual increase slows from 3% to 2%, the level is still rising; it is rising less quickly. Prices fall only when the relevant price comparison is negative. A change from 2.5% to 2.6% is an increase of 0.1 percentage point in the inflation rate.
Why your usual lunch can feel different
OpenDOSM explains that the CPI tracks a consistent basket of household purchases. An aggregate index is a reference point, not an individual receipt. The dashboard also lets readers explore categories and geographic differences.
To compare your own spending, keep the order, portion, outlet and extras consistent. A different drink, an added side or a delivery charge can change the total without showing a change in the menu price of the original dish.
What the figures cannot explain on their own
The index does not establish why a particular operator changed a price. It cannot, by itself, reveal the restaurant’s ingredient costs, wages, rent, wastage or profit. Drawing those conclusions requires evidence from that business. A claim that a higher menu price proves a higher margin would go beyond this release.
Questions worth bringing to the table
For diners, a useful question is what changed in the total bill and whether the comparison is like for like. For a conversation with a chef or owner, ask which costs changed, over what period, and whether they altered a portion, ingredient or menu. Record their answer as their account, then check any wider claims against independent evidence.
Figures checked on 5 November 2026. September was the latest period shown on the official dashboard at the time of research. This article is a data explainer, not a survey of restaurant prices.
Sources & reading
Sources checked on 5 November 2026. Links support the specific facts attributed to them; questions and reading examples are our editorial suggestions.
- DOSM: September 2026 CPI media release, 19 October 2026
- OpenDOSM: consumer-prices dashboard and index explanation
Spotted an error? Tell our team with the article title and supporting details.